
Technical Analisys
 Technical Analysis
How to Master Candlestick Charts and Boost Your Trading Profits
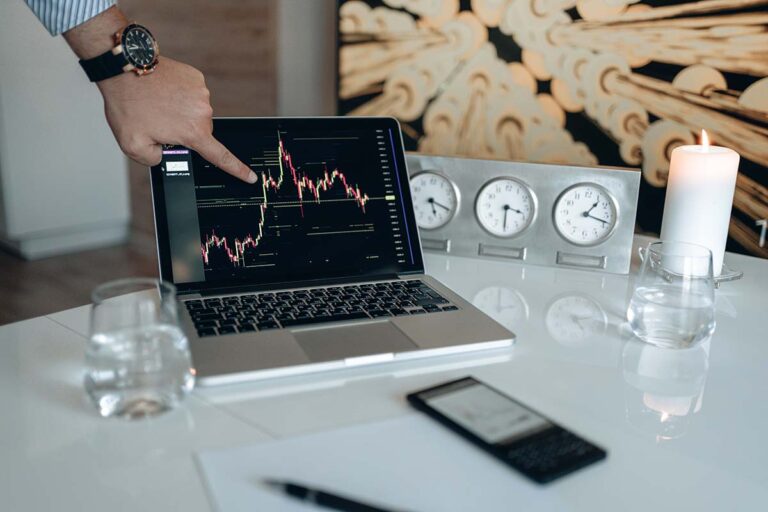
Candlestick charts are a way to show how prices change. They were first used in Japan in the 18th century. Traders and investors use these tools to study a lot about the patterns and trends of different financial instruments, such as stocks, currencies, commodities, and indices. Individual candles that make up
Advertisement
Recent news


Advertisement

Popular today


Partner links
Advertisement
Join our newsletter
Subscribe for unique perspectives and original reporting, every weekday.
By submitting my information, I agree to the Privacy Policy and Terms of Service.